Import datasets that are different
This tutorial explains how you can import a dataset which is somehow different from the example that was discussed in the Show your own data tutorial. Here we assume the reader is familiar with exporting a CSV and reading it in Gapminder Offline.
Data contains only one time point
Data contains something else than countries
Open the example file in Excel: Teachers time reports. ⏬ XLS
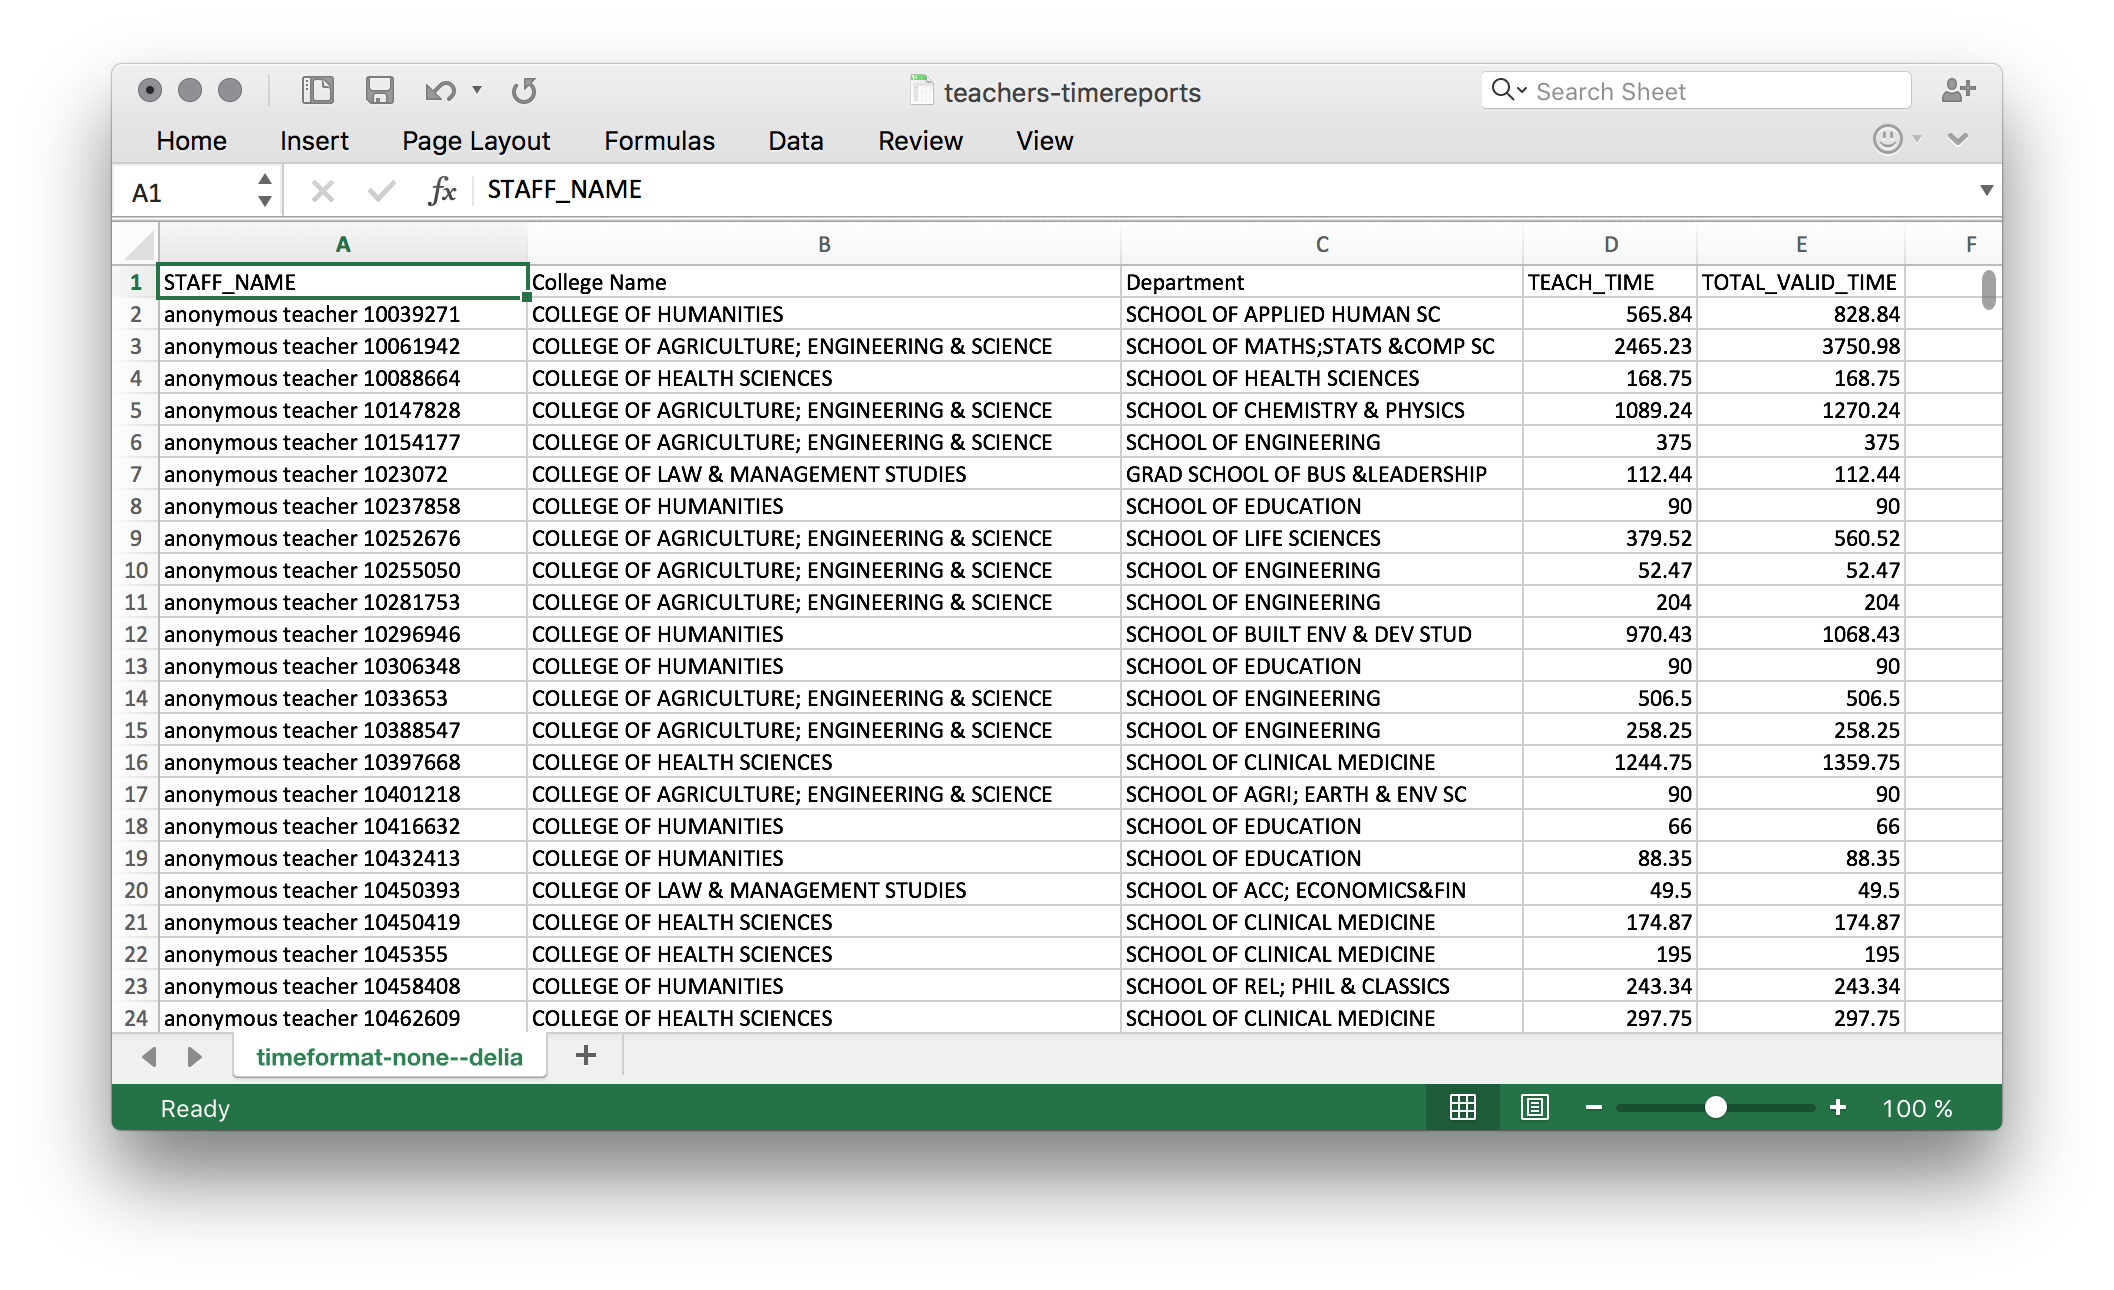
Since there is no time dimension in this particular file you’ll have to cheat the software to consume it. Add a fake time point for all of your values. Insert a column after the teacher’s anonymized names and fill it with a single value like “2017”. Put “time” in the header (you can put “year” or anything).
Now the file matches the format “time goes down” in Gapminder Offline tool.
“Save As” the file as CSV. Solution: ⏬ CSV
Open the file you saved in Gapminder Offline
You can select text categories from the data you have imported to be colors.
Below is the interactive examle that shows the result.
If you are into coding, below is a code snippet you would use to display this data without using Gapminder offline. If you copy and paste it into your website it should still work
<div id="placeholder" class="example-placeholder" style="max-width: 720px; height: 500px; padding-top: 0;"></div>

<link rel="stylesheet" href="//s3-eu-west-1.amazonaws.com/static.gapminderdev.org/vizabi.css">
<link rel="stylesheet" href="//s3-eu-west-1.amazonaws.com/static.gapminderdev.org/bubblechart.css">

<script src="//d3js.org/d3.v4.min.js"></script>
<script src="//s3-eu-west-1.amazonaws.com/static.gapminderdev.org/vizabi.js"></script>
<script src="//s3-eu-west-1.amazonaws.com/static.gapminderdev.org/bubblechart.js"></script>

<script>
var config = {
    "locale": {
      "filePath": "//s3-eu-west-1.amazonaws.com/static.gapminderdev.org/assets/translation/"
    },
    "data": {
      "reader": "csv",
      "path": "https://raw.githubusercontent.com/Gapminder/vizabi-website/develop/data/teachers-timereports.csv"
    }
};

Vizabi("BubbleChart", document.getElementById("placeholder"), config);
</script>